The ultimate Intune Troubleshooting Guide
Introduction
This post walks through a structured approach to investigating unexpected behavior between Microsoft Intune and a managed endpoint. The scenario: you configure something in the Intune admin center, the device should apply it - but something goes wrong.
This can affect any of the following content types:
- Device configuration and compliance profiles
- Endpoint security profiles
- Settings Catalog policies
- Scripts and Remediations (formerly Proactive Remediations)
- Win32 apps, Store apps, and LOB apps
Quick tips
- Use the new device detail page in the admin center
- Intune uses new communication protocols and declarative configuration through MMP-C and WinDC and Teams notification delivery Read more
- Configuration uses the MDM protocol stack, including SyncML
- Apps, scripts and remediation use the Intune Management Extension (IME), a dedicated service
- Leverage properties catalog to fetch client side attributes and discover through Advanced Analytics, (Multi-) Device Query
Troubleshooting in a nutshell
Follow these steps for troubleshooting Intune managed devices:
- Verify if the issue is seen on multiple devices or if it only persists for a single device/user
- Check if the user has an Intune license assigned
- Ensure all required network endpoints are available
- No conflicts or profile errors should be visible from the admin center
- Verify client side reports, logs and settings
- If troubleshooting takes longer than > 2 hours, I recommend re-staging the device instead
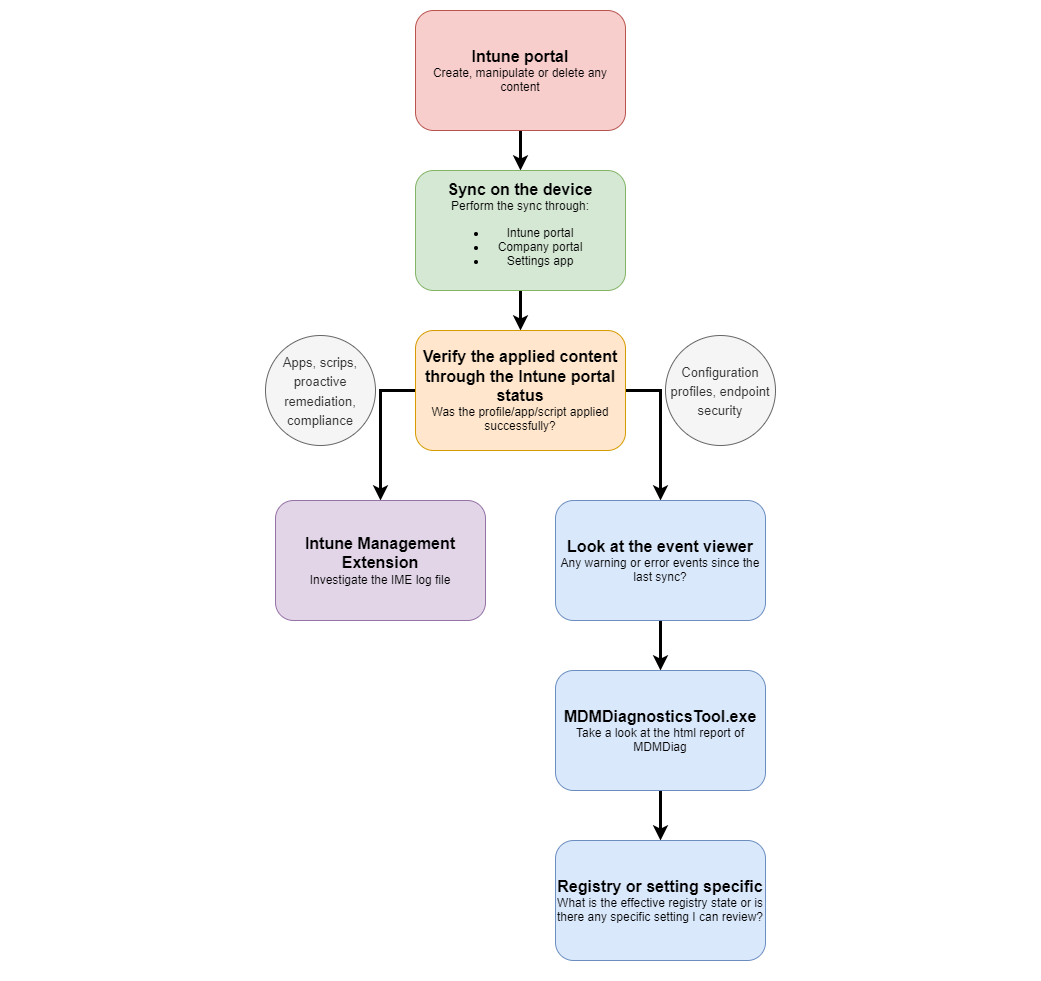
Troubleshooting flow
- Start in the Intune portal - make your change, then check the assignment and status of the profile, app, or script from the portal side first.
- Force a sync on the device - don't wait for the next automatic check-in. Trigger a sync via the Intune portal, Company Portal, or the Windows Settings app or PowerShell.
- Check whether the content was applied - go back to the Intune portal and look at the device or content status. Did it land successfully or is there an error?
- If it's an app, script, or Remediation → open the IME log file. This is where app installs and script executions are recorded in detail.
- If it's a configuration profile or Endpoint Security policy → start with the Event Viewer. Look for warnings or errors in the MDM channel around the time of the last sync.
- Still no answer? → Run MDMDiagnosticsTool.exe and open the HTML report. It gives you a full overview of everything Intune pushed to the device and the resulting state.
- Last resort: the Registry - verify directly whether the setting actually landed on the device and what its current effective value is.
Top sources
- Intune portal - see applied profiles and apps to devices & users
- Diagnostics and MDMDiagnostics - see all diagnostics data from the MDM channel
- IntuneManagementExtension log files - IME is the component that is responsible for PowerShell scripts, apps and compliance state from Intune on the end device
- Event viewer - most of the relevant events are displayed here, especially if you don't know where to look in particular
- Registry - is always the last point to verify settings
1. Intune Admin Center
The admin center is always the first stop. There are three perspectives worth knowing:
From the content side (policy or app)
Navigate to a specific profile, compliance policy, or app and check:
- Device assignment status - which devices received it and in what state
- Per-setting status (Settings Catalog) - granular insight into which individual settings succeeded or failed
- Last check-in time - a stale timestamp here is often the culprit before anything else
From the device side
Navigate to Devices > All Devices, select the device, and review the Tools and reports and other tabs. This gives you a full picture of everything targeted at that device.
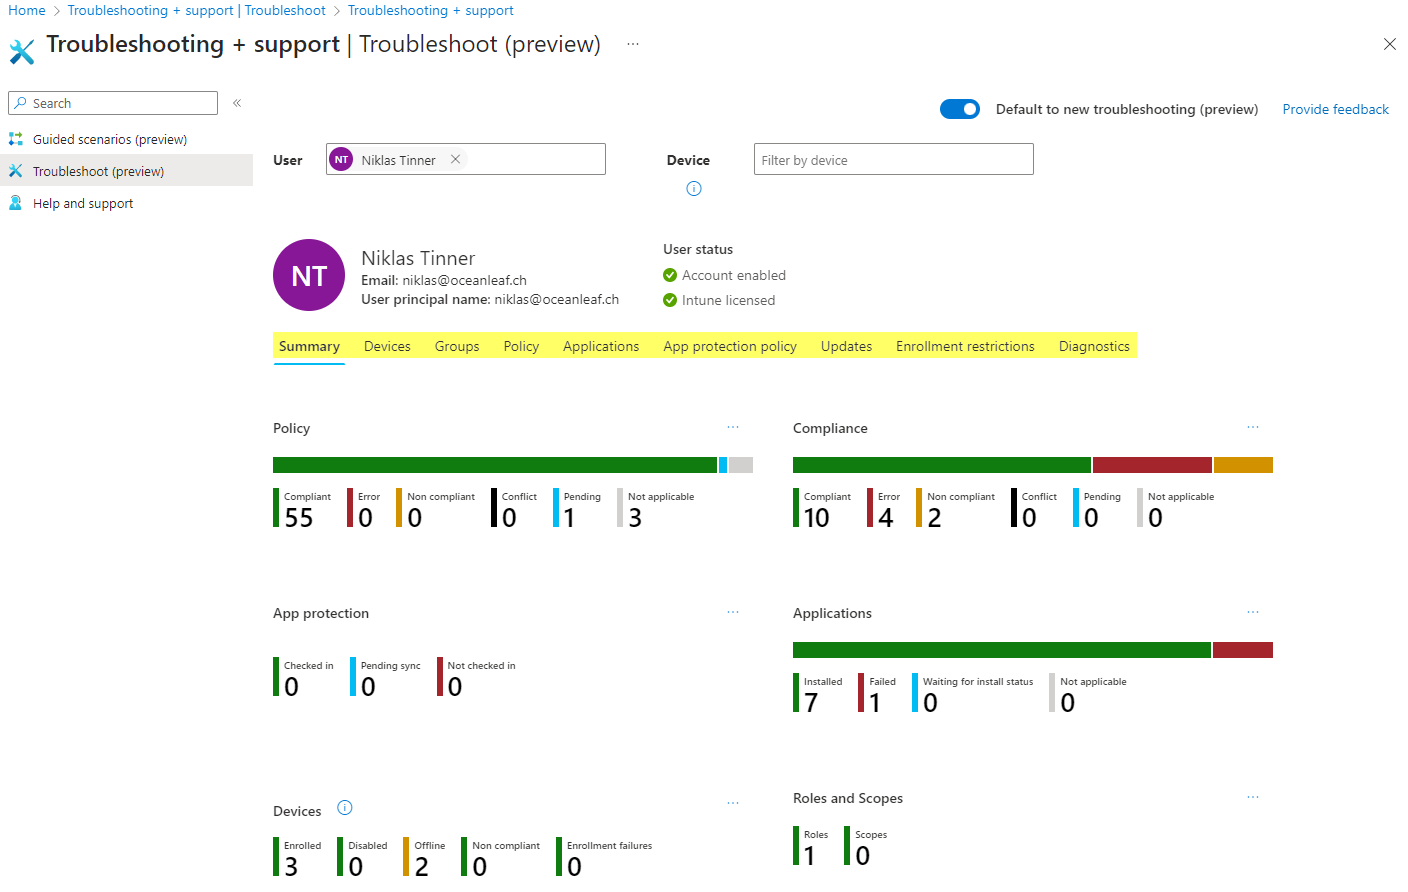
Troubleshooting + Support
The Troubleshooting + support blade (search for a user) shows all of their devices and the assignment status across policies, apps, and compliance. Useful when you want to quickly rule out user-specific assignment issues vs. device-specific ones.
2. Sync the Device
Before diving into logs, make sure the device has received the latest changes. The standard sync cadence for Windows is:
- Every 3 minutes for the first 15 minutes (post-enrollment)
- Every 15 minutes for the following 2 hours
- Every ~8 hours thereafter
Do not spam sync the device multiple times in a short time period.
To force a sync:
- From the portal: Devices > select device > Sync
- From the device: Settings > Accounts > Access work or school > Info > Sync
- Via PowerShell (local):
[Windows.Management.MdmSessionManager,Windows.Management,ContentType=WindowsRuntime]
$session = [Windows.Management.MdmSessionManager]::TryCreateSession()
$session.StartAsync()
3. Diagnostics and MDMDiagnosticsTool
When portal-level data isn't enough, diagnostics are the next step. You have two options:
Remote (from the Intune portal)
Select a device in the admin center and click Collect diagnostics. After a few minutes, the package appears under Device diagnostics on the left panel and can be downloaded. This is the preferred method for remote or unattended devices. It includes:
- Registry exports
- Event Viewer logs
- Command outputs
- Key log files
Local (on the device)
Open an elevated Command Prompt and run:
MDMDiagnosticsTool.exe -out C:\Temp\MDMDiag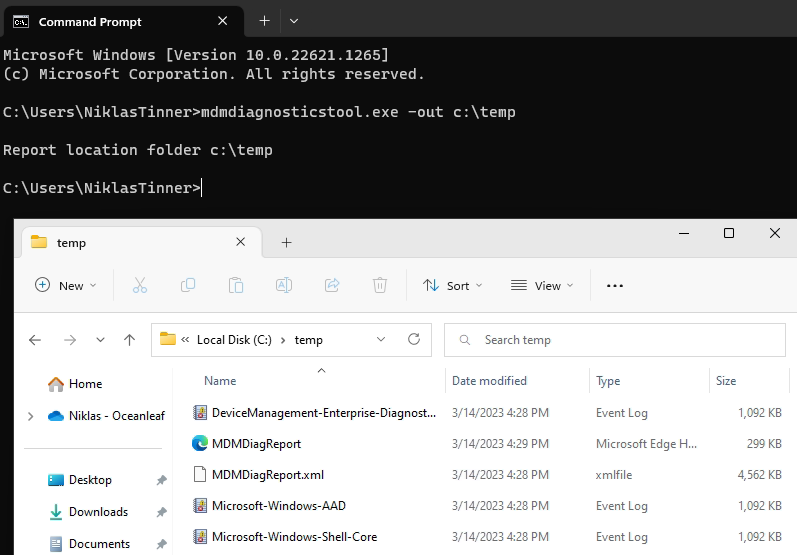
What you get:
- Exported event viewer entries from MDM-relevant channels
MDMDiagReport.html- a human-readable overview of sync state, enrolled policies, and detected errors- A verbose
.xmlfile containing the full MDM sync payload
The report can also be generated from Settings > Accounts > Access work or school > Info > Create report
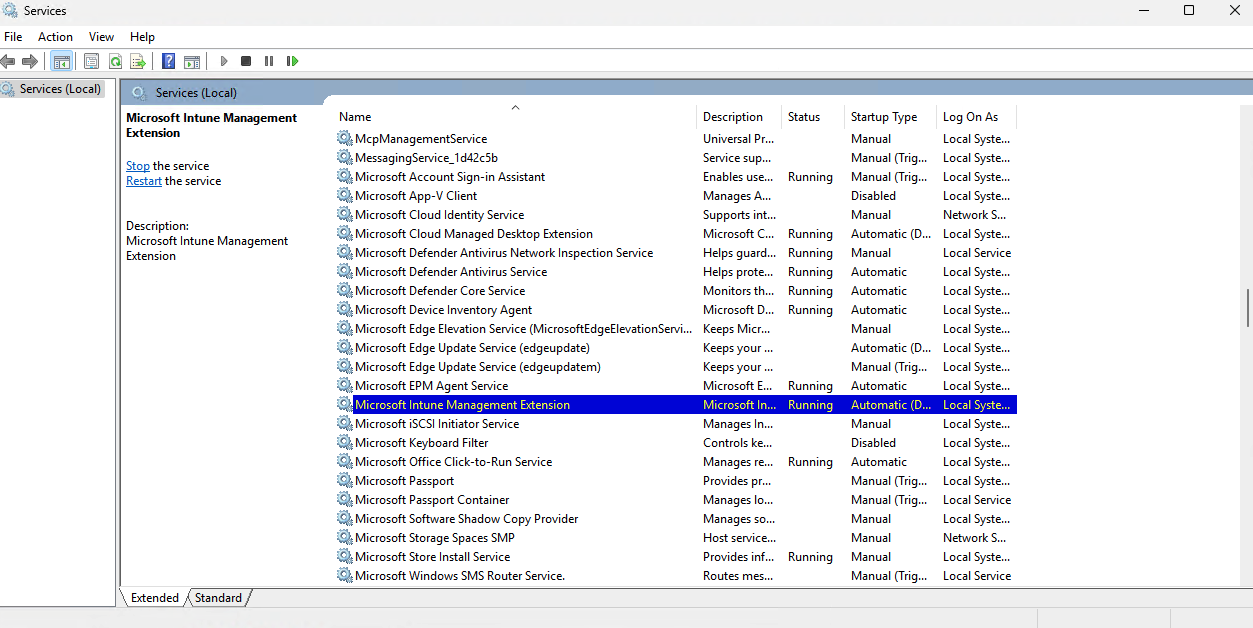
4. IntuneManagementExtension (IME) Logs
The Intune Management Extension handles Win32 apps, PowerShell scripts, Remediations, and compliance evaluation on Windows devices. Its log files are the go-to for anything in those categories.
Service to restart:
Log location:
C:\ProgramData\Microsoft\IntuneManagementExtension\Logs\Key files:
IntuneManagementExtension.log- Main log covering app installs, script execution, and policy evaluationAgentExecutor.log- PowerShell and Remediation script outputClientHealth.log- IME health evaluationSensor.log- Endpoint analytics data collection
Recommended tool: CMTrace for real-time log highlighting. Focus on yellow (warning) and red (error) entries and read the surrounding lines for context.
5. Event Viewer
The Event Viewer is useful for finding events you weren't specifically looking for broad issues with MDM communication, Entra ID join state, and enrollment status show up here.
Primary Intune channel:
Applications and Services Logs > Microsoft > Windows >
DeviceManagement-Enterprise-Diagnostics-Provider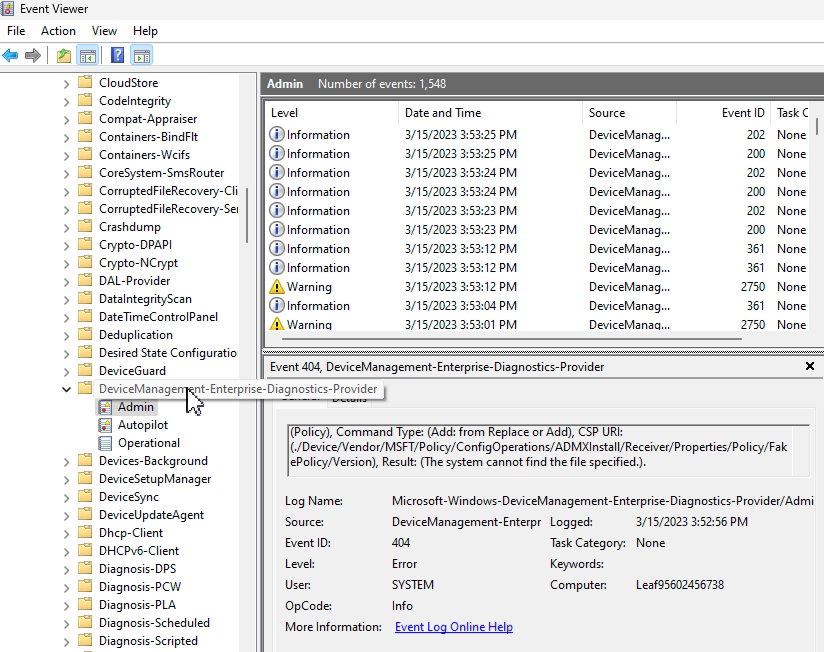
Filter the log to Critical, Error, and Warning levels to reduce noise. Additional relevant channels.
6. Registry
The registry is the final confirmation point - use it to verify whether a specific setting actually landed on the device, regardless of what the portal says.
Key paths:
MDM policy area: HKLM:\SOFTWARE\Microsoft\PolicyManager\
More information
- Every device must have an Intune MDM device certificate Read more
- Use Oli Kieselbachs SyncML viewer for further sync insights
- Speedup / troubleshoot Proactive Remediation
- If you are looking for Edge settings, open Edge and type edge://policy in the address bar to see the applied policies
- Multi Admin Approval can block certain admin actions and requires a dual control system Read more
powered by Oceanleaf