Global Secure Access Unified Monitoring & Logging
Introduction
Global Secure Access is a holistic network security solution from Microsoft, which is identity-centric and fully integrated in the cloud ecosystem.
Monitoring and logs are a crucial part of deploying and operating the product and discovering feature usage, gaps and trends. 📈 In this post we will unveil the various options to query logs and visualize data. Additionally, I am providing a community-powered Azure Workbook to empower admins with unified insights and with a single dashboard to filter data from GSA (clients).

GSA Logs 🔎
Let's dive into the data and logs of Global Secure Access (GSA).
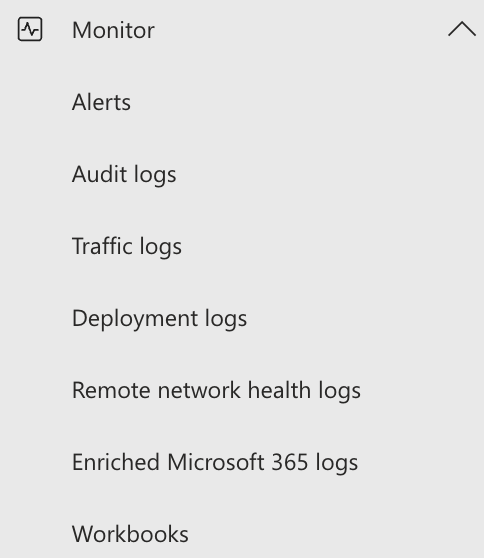
Portal 🌐
The integrated logs & monitor section in Microsoft Entra Global Secure Access helps admins by providing essential visibility.
- Audit logs track configuration changes for troubleshooting and compliance.
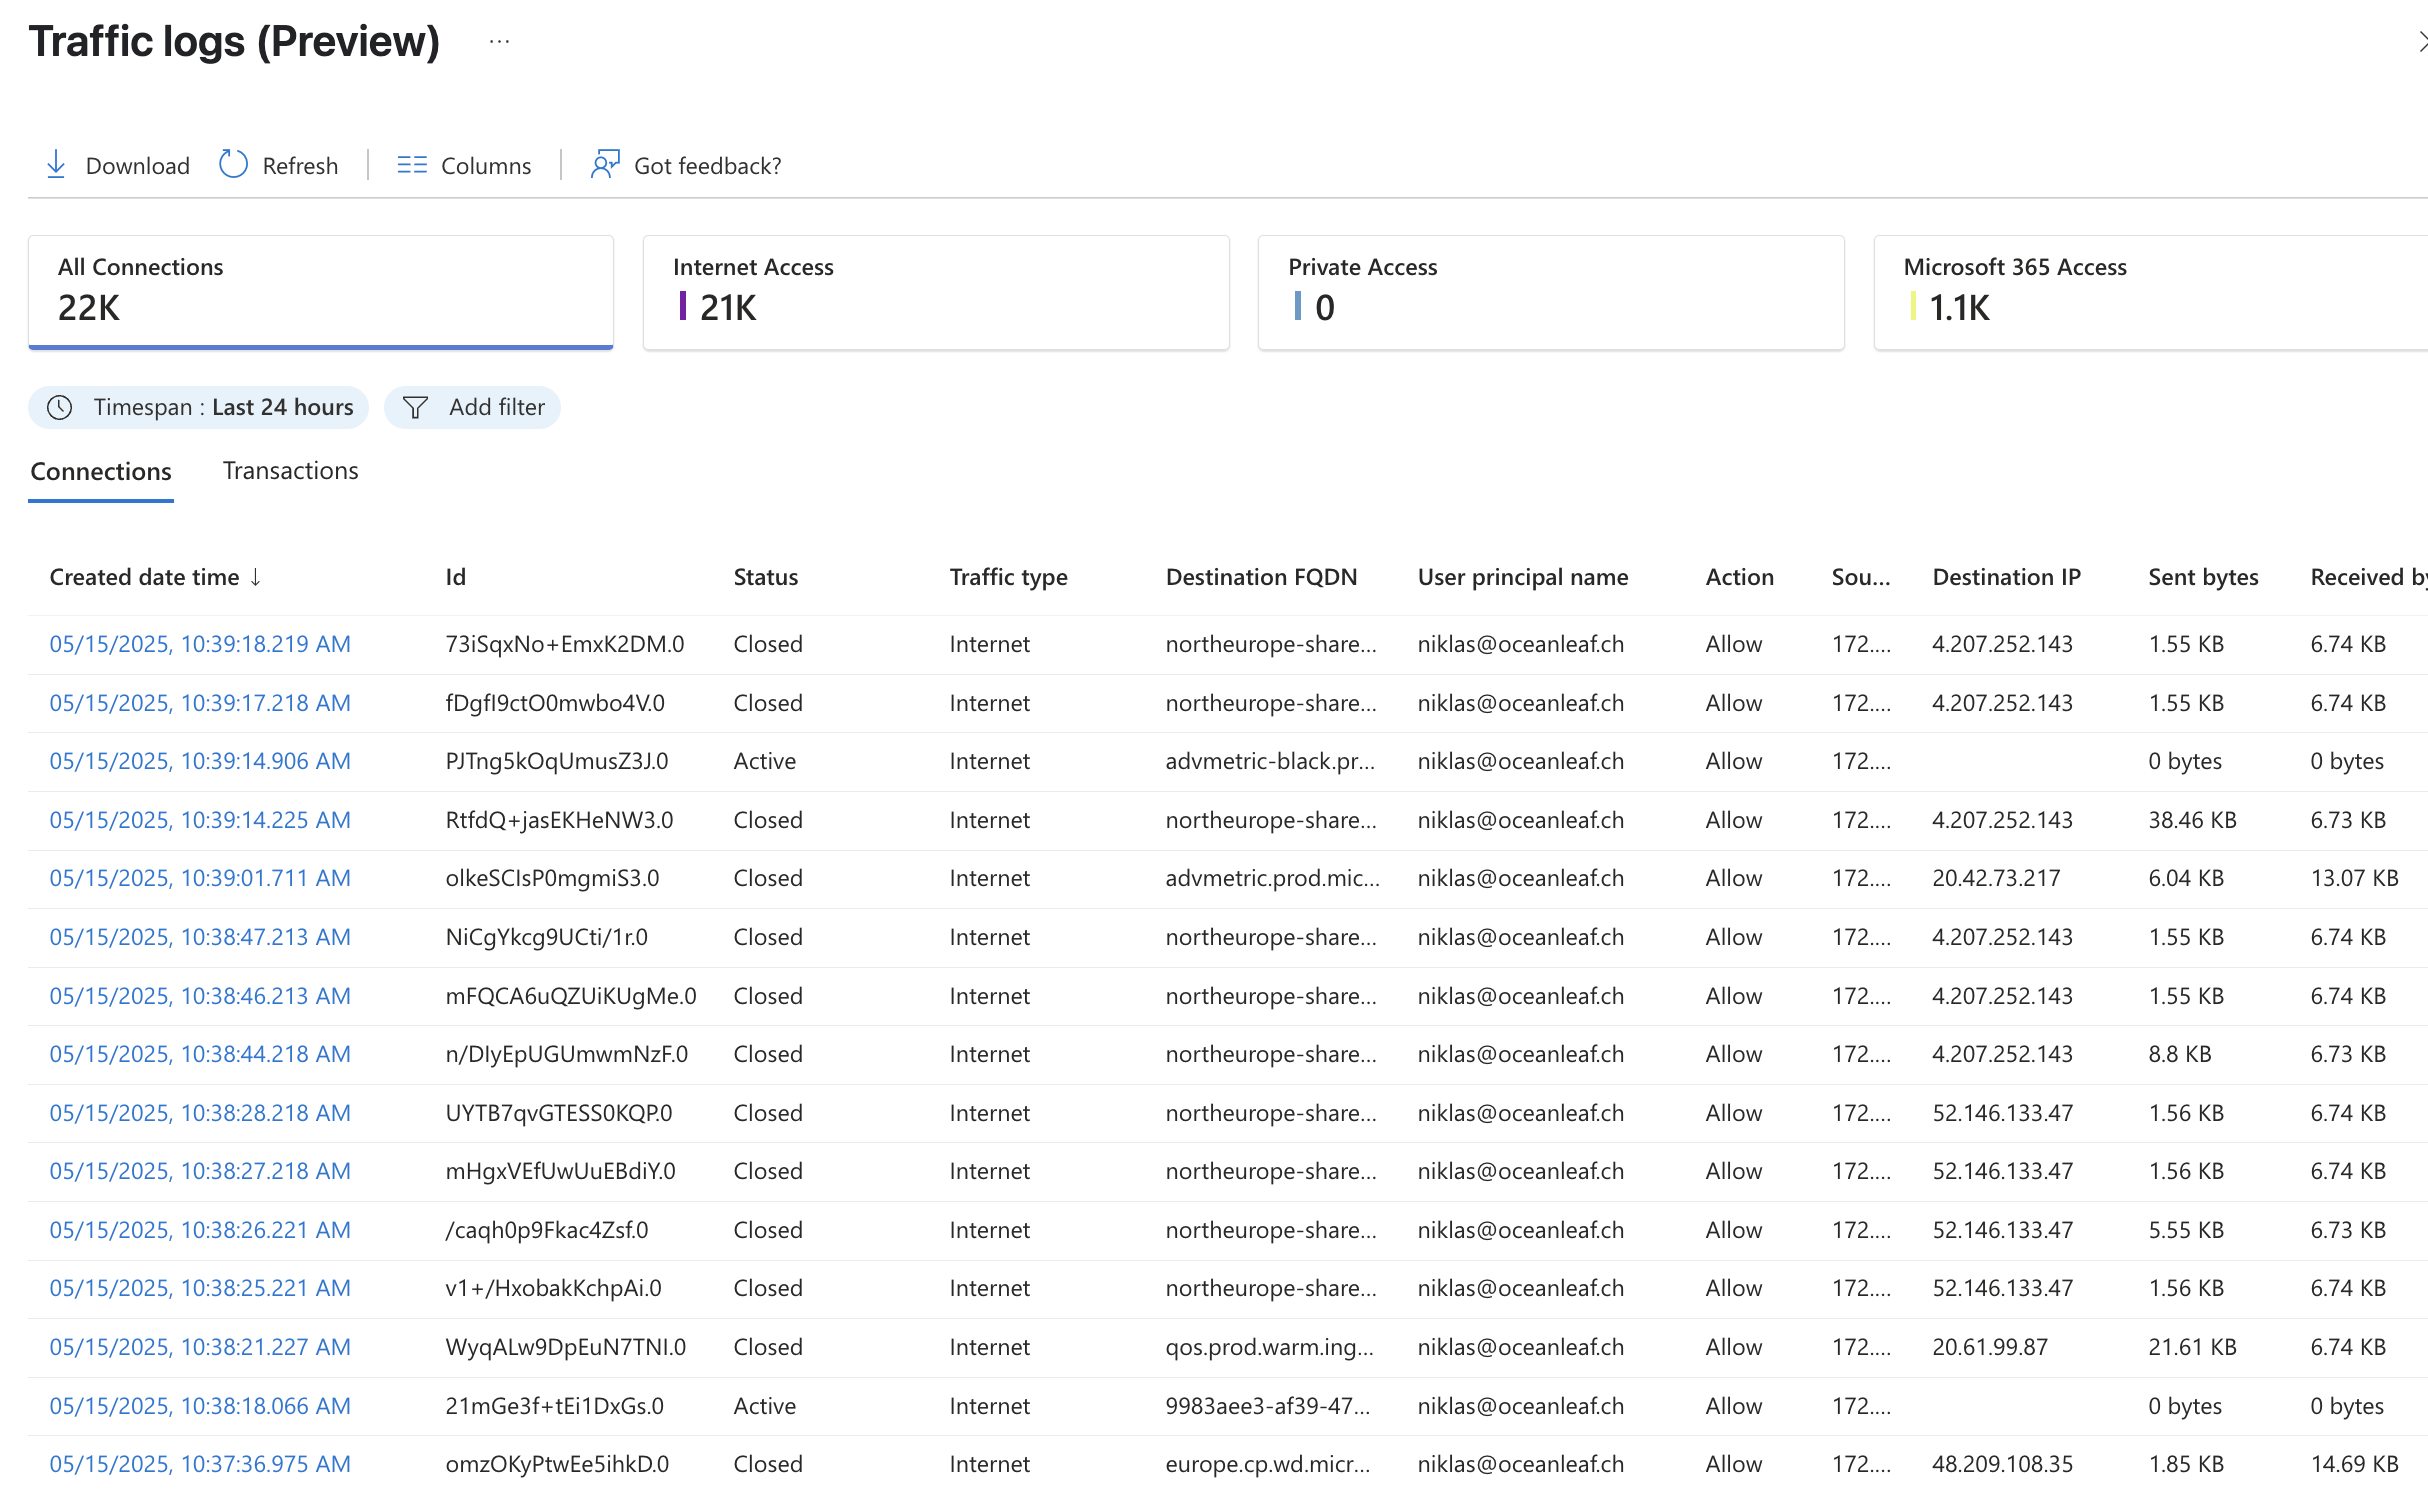
- Traffic logs show detailed connection data, helping to monitor usage and detect anomalies.
- Remote network health logs monitor external and on-premises connection performance.
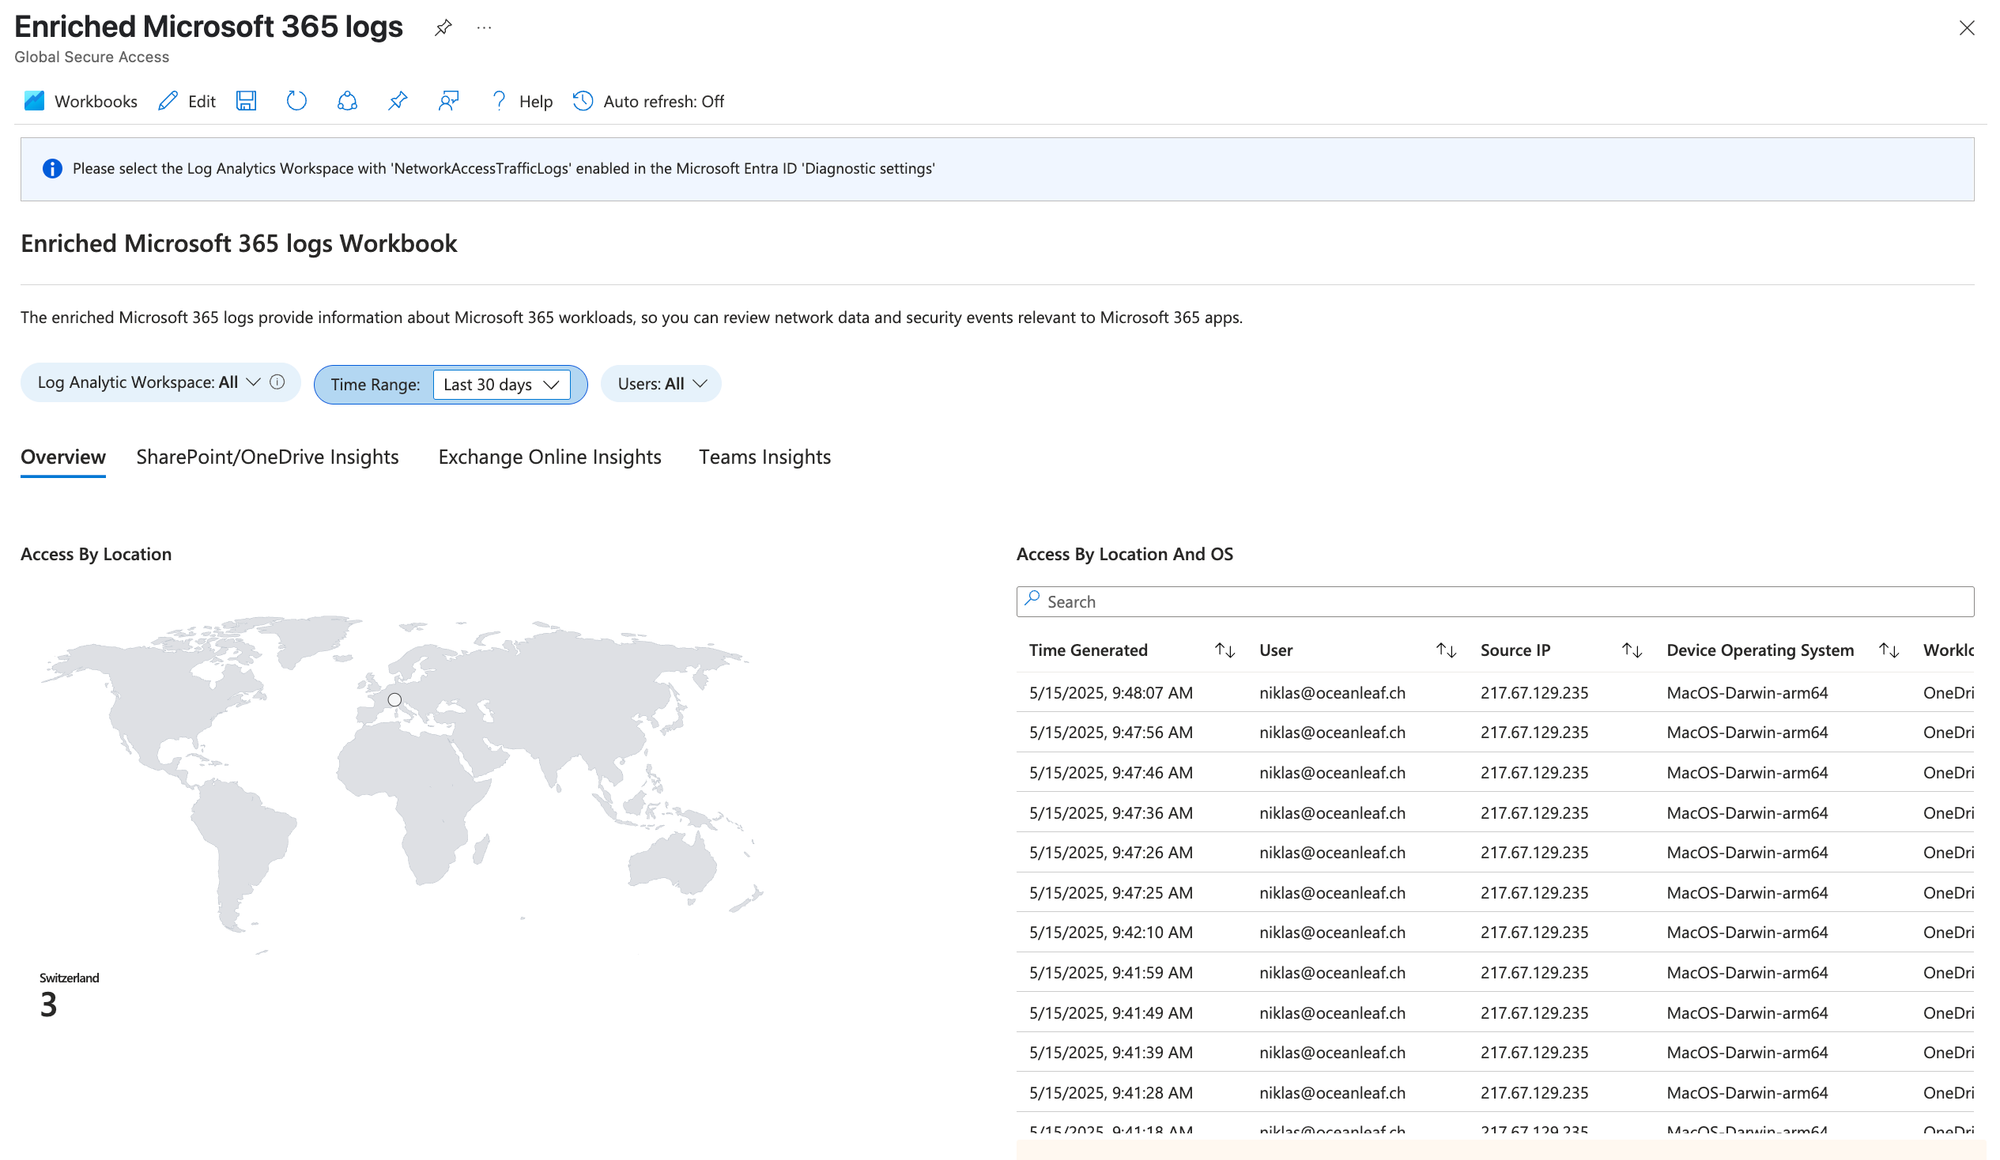
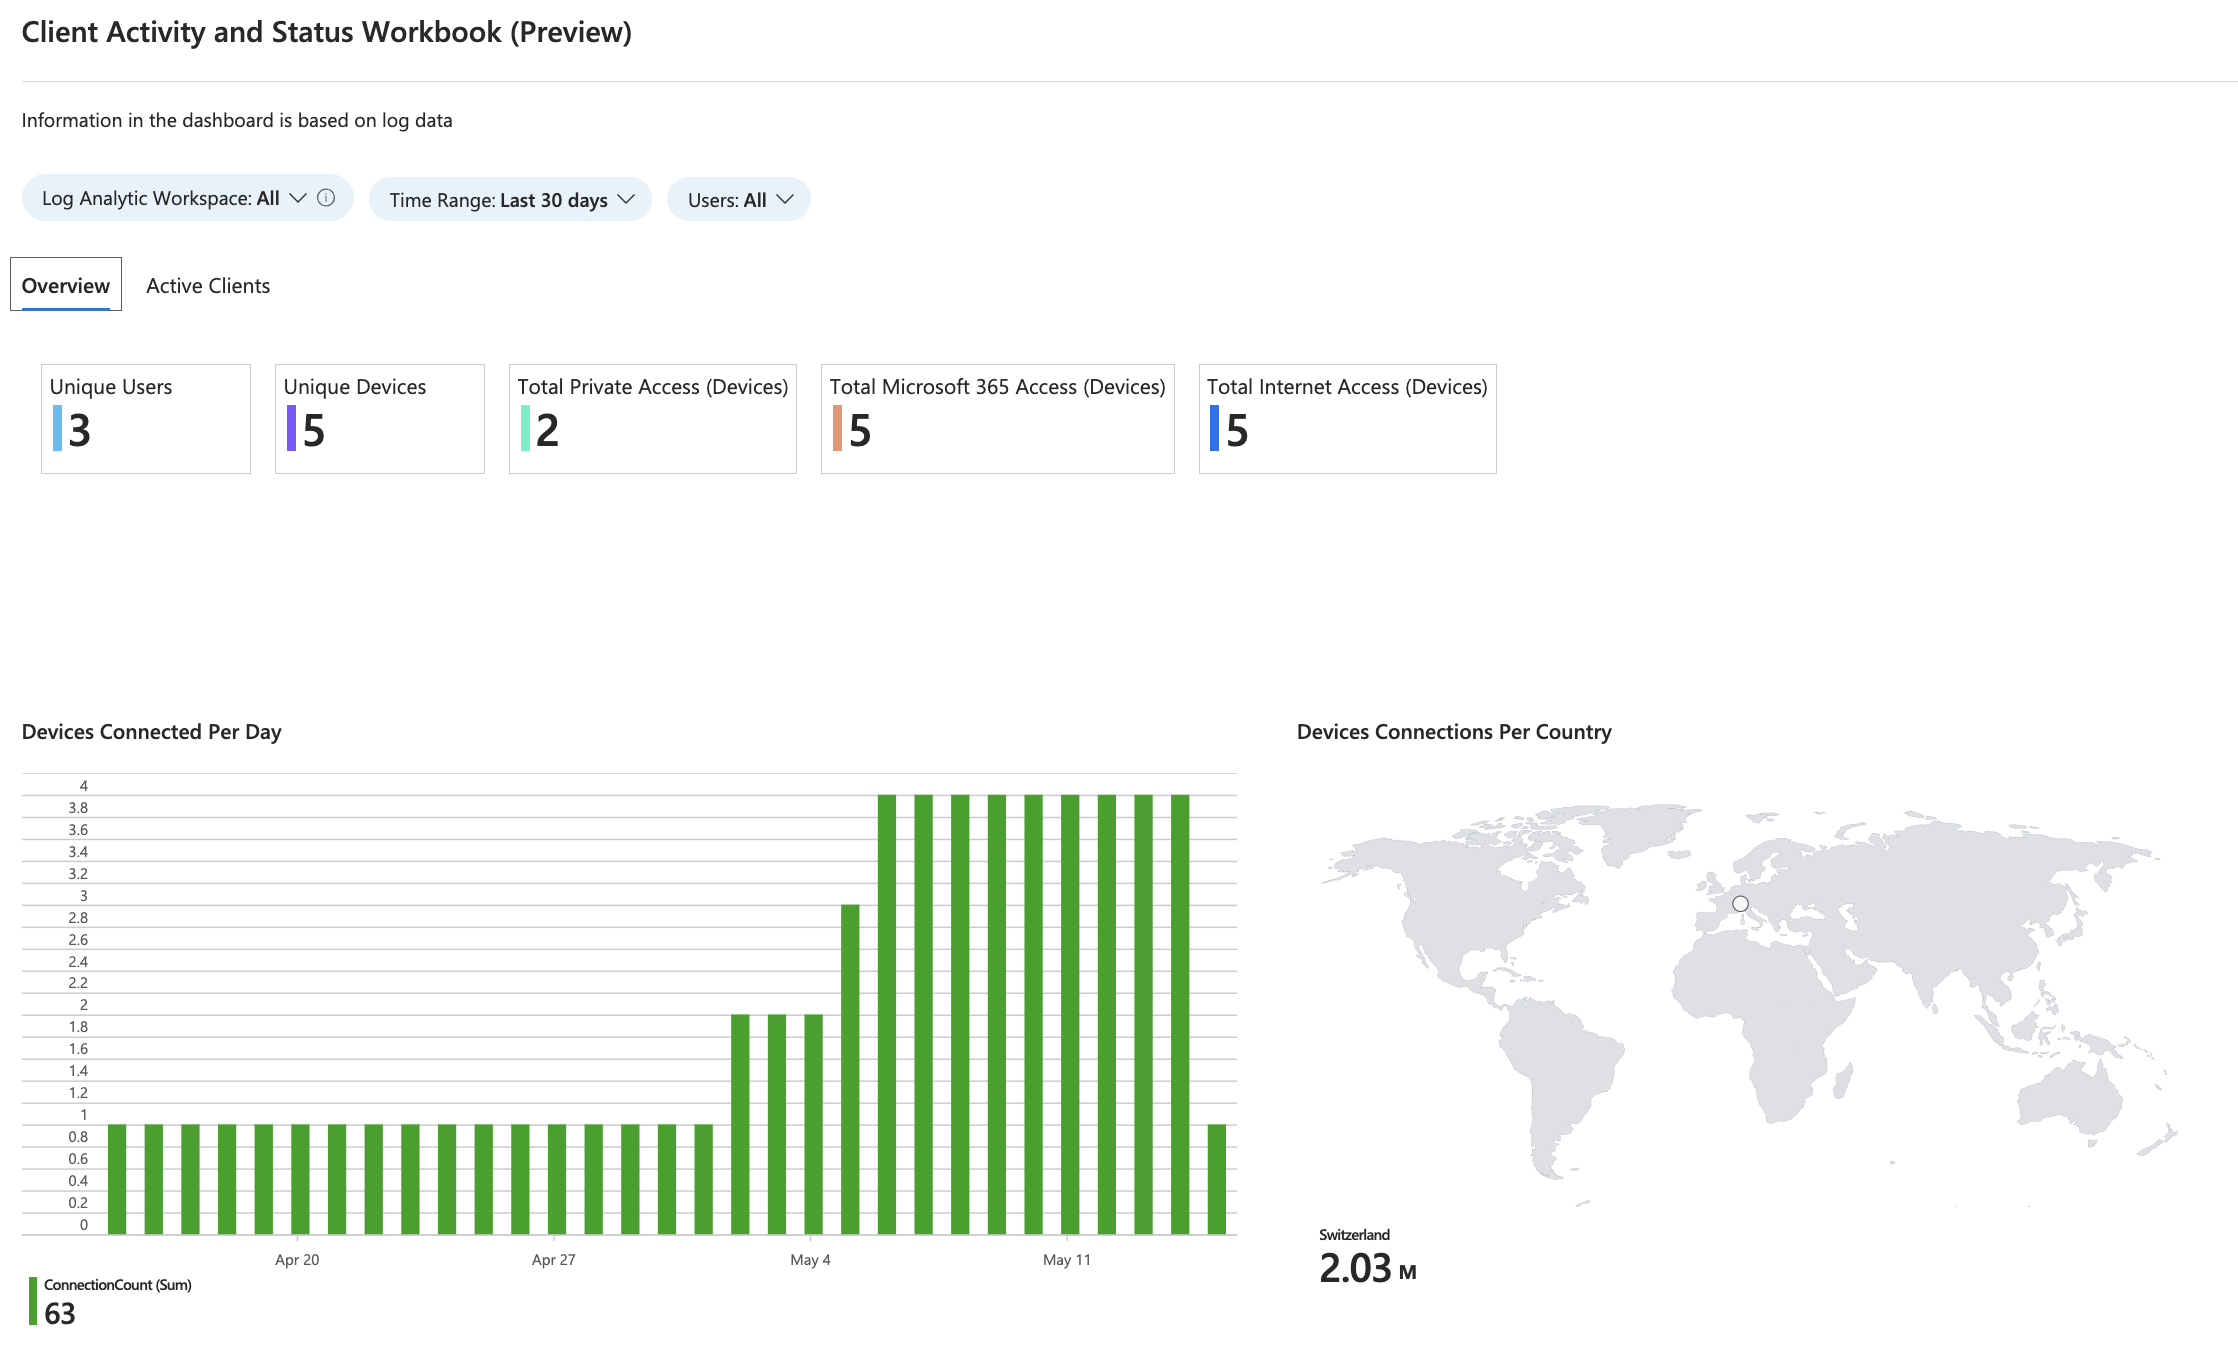
- Enriched Microsoft 365 logs -> newly available as a Workbook
- Workbooks visualize data from all logs for quick analysis and overview on the environment.
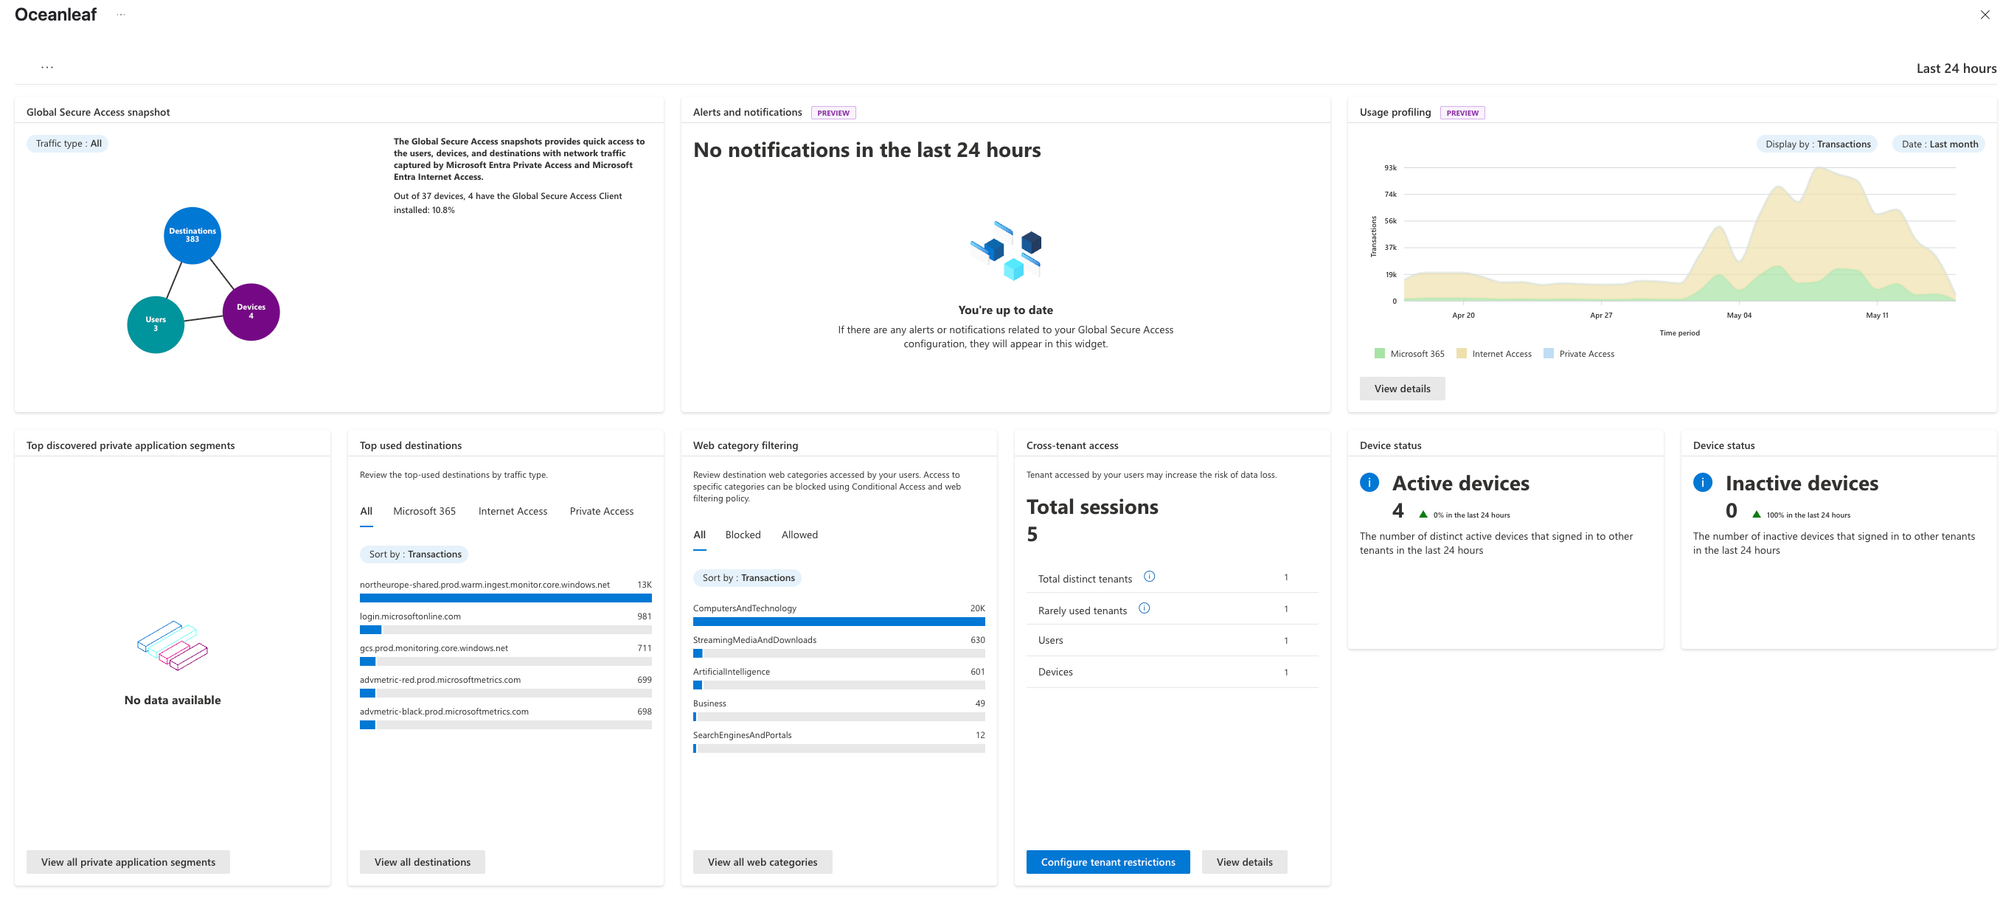
How this helps admins:
- Quickly detect and fix connection problems
- Monitor security and compliance in real time
- Understand user behavior and usage patterns
- Investigate and respond to incidents faster
- Optimize and document changes to network and access policies
KQL + Log Analytics Workspace 🕵️♀️
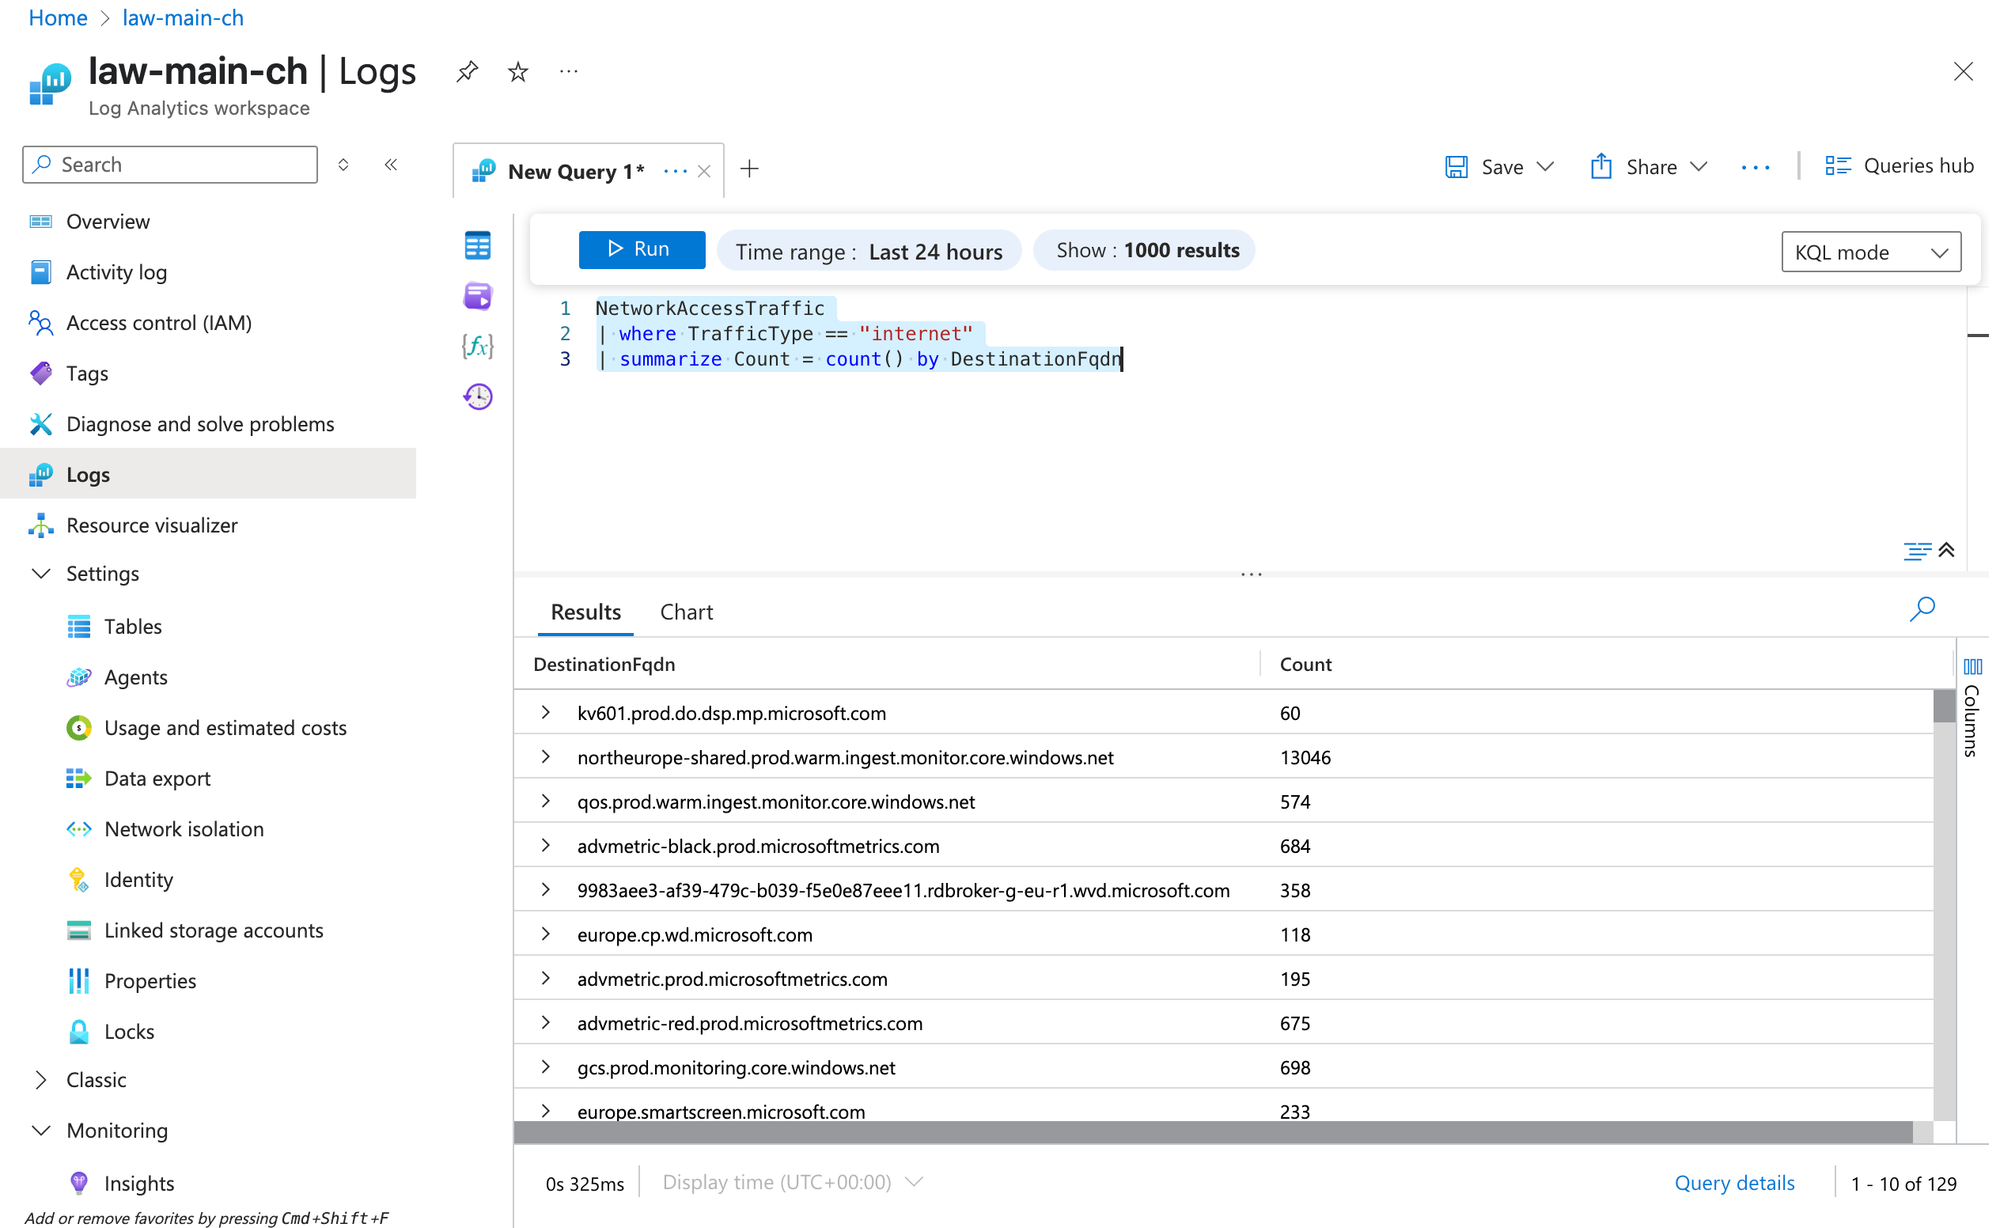
To query logs in a Log Analytics Workspace (LAW), we can use Kusto Query Language (KQL). KQL is a powerful, read-only language designed to explore large datasets efficiently. It allows filtering, sorting, summarizing, and visualizing log data.
In the Azure portal, open Logs in your LAW, select the relevant table (e.g., NetworkAccessTraffic), and enter a query like:
NetworkAccessTraffic
| where TrafficType == "internet"
| summarize Count = count() by DestinationFqdn
This example filters for internet traffic and counts connections per DestinationFQDN. KQL helps admins quickly find patterns, trends, troubleshoot issues, and monitor general activity.
Tables
The following tables can be connected in Microsoft Entra under Monitoring & Health at diagnostics settings. These tables will then be forwarded to your Log Analytics Workspace.
| Table Name | Description |
|---|---|
| NetworkAccessTraffic | Contains logs of network access traffic that can be used for policy, risk, traffic management, and user experience monitoring. |
| RemoteNetworkHealthLogs | Provides logs about the health status of remote networks connected through Azure network access services. |
| NetworkAccessAlerts | Contains alert records generated by Azure network access services for policy violations, or operational issues. |
| NetworkAccessConnectionEvents | Logs connection events for users and devices accessing the network via Azure network access services. |
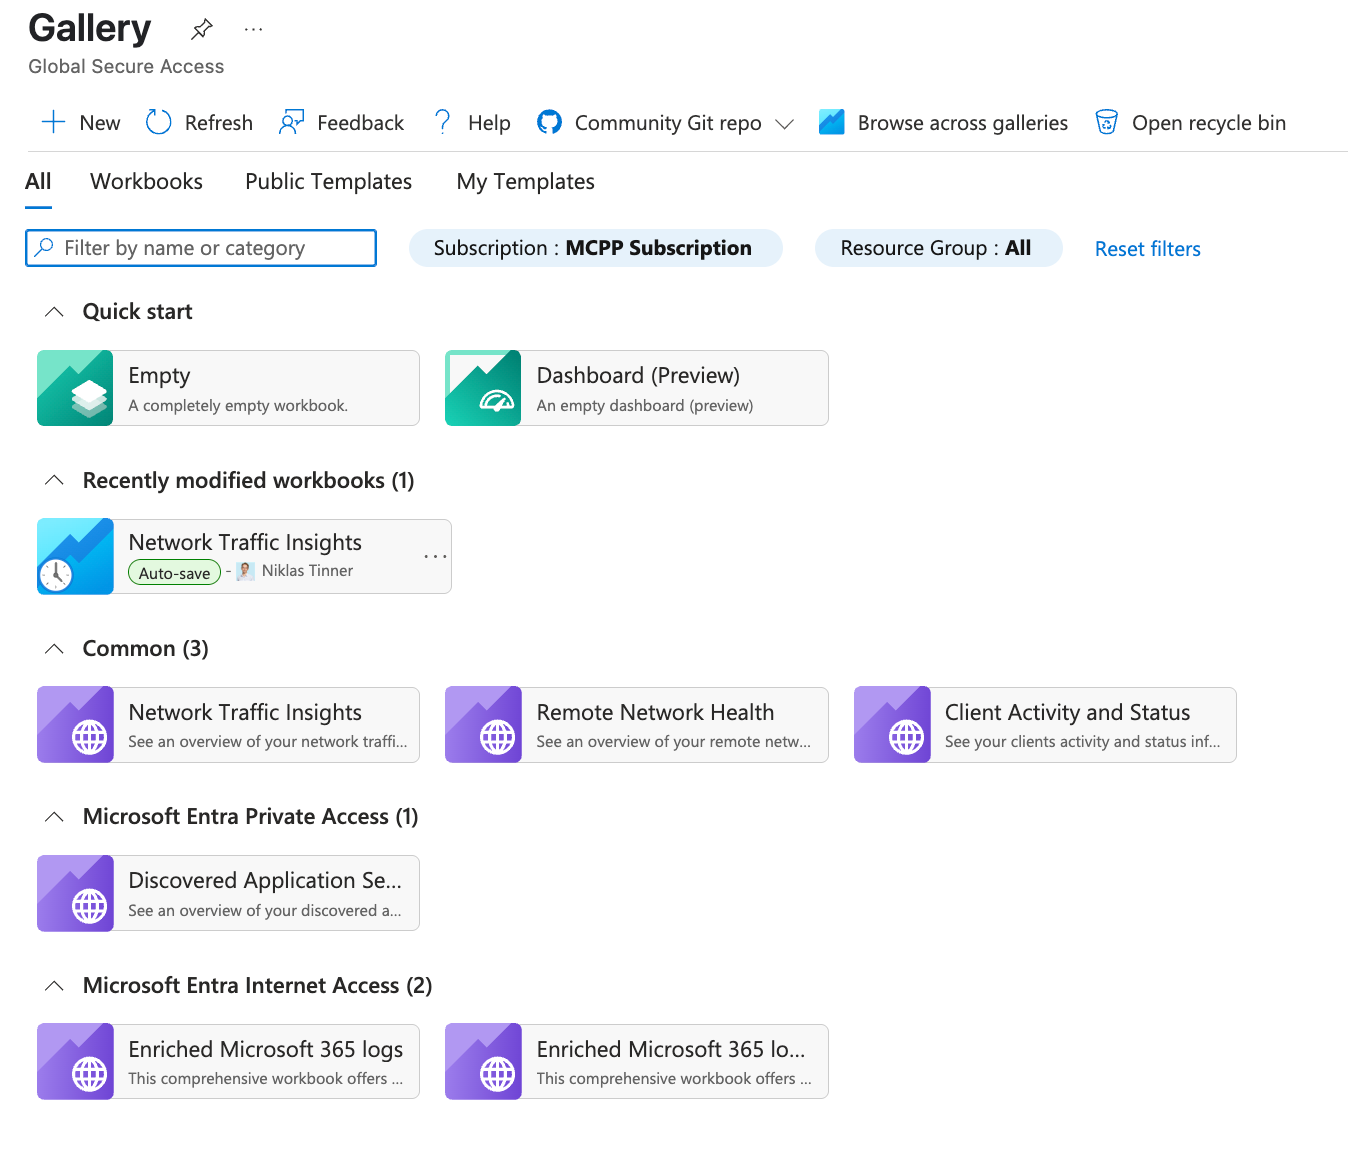
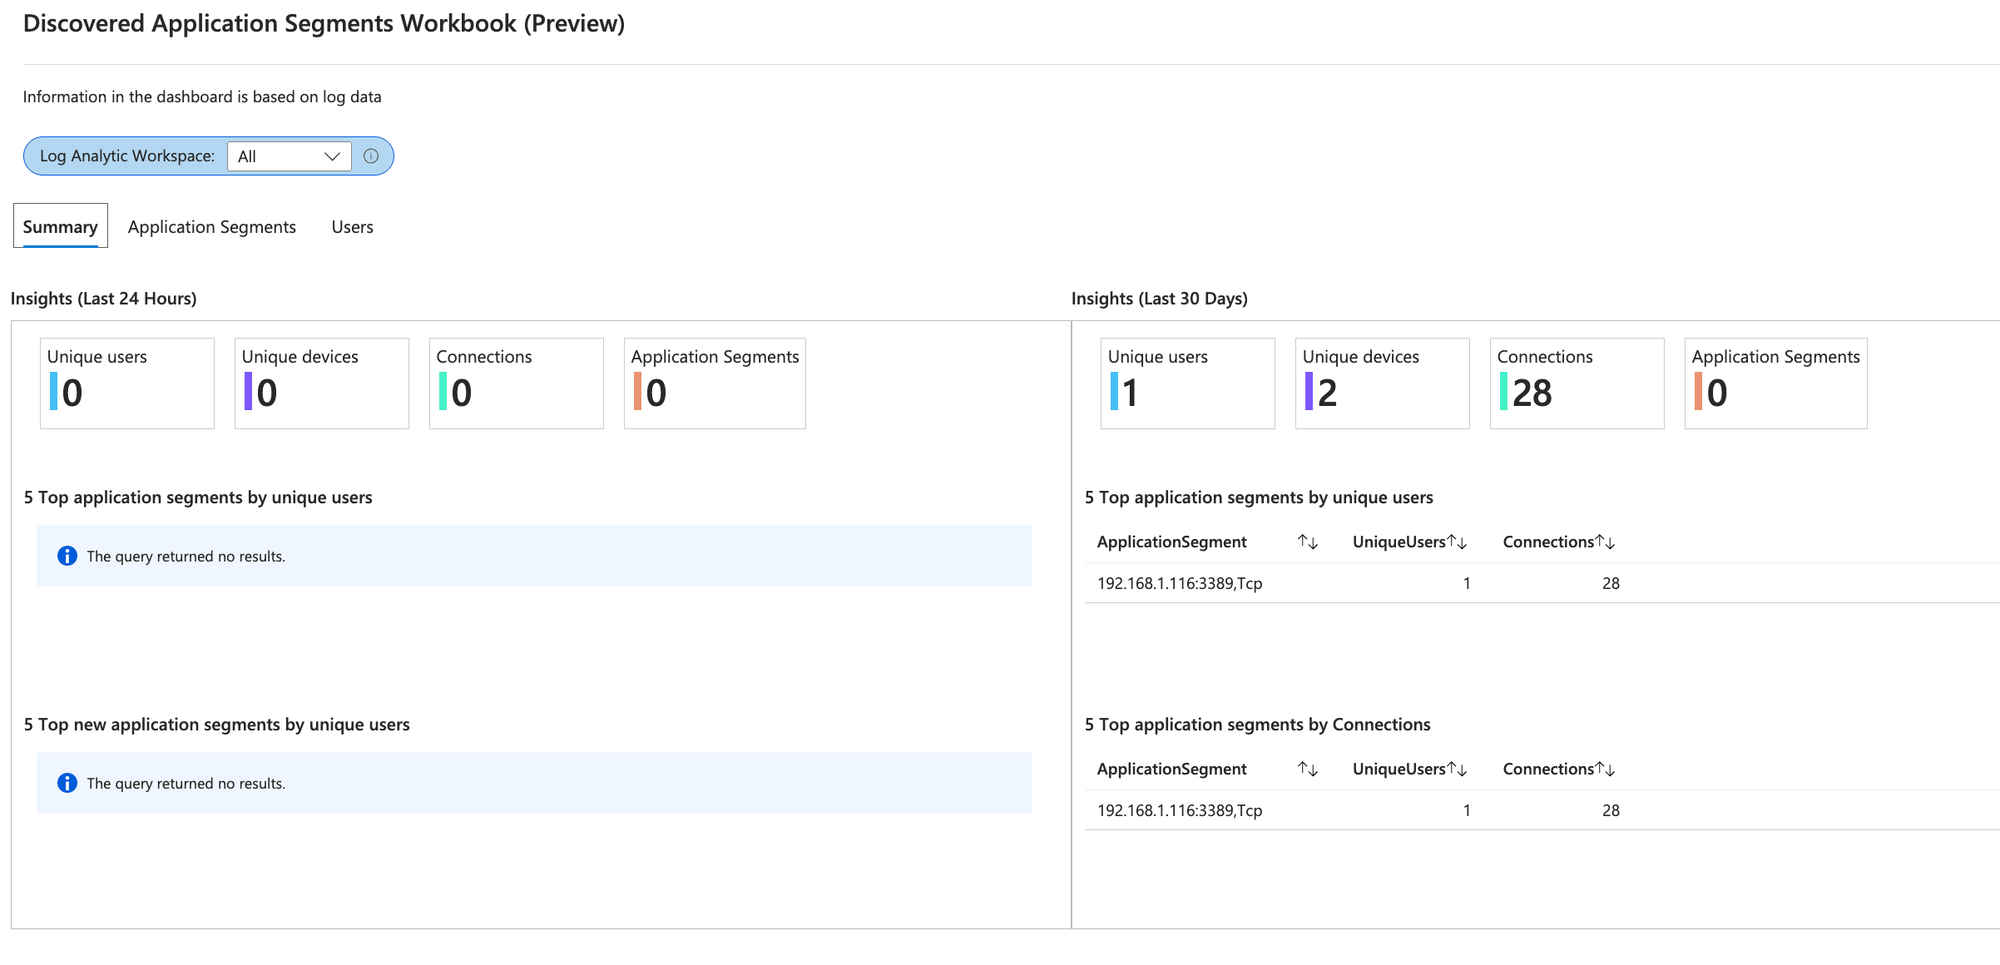
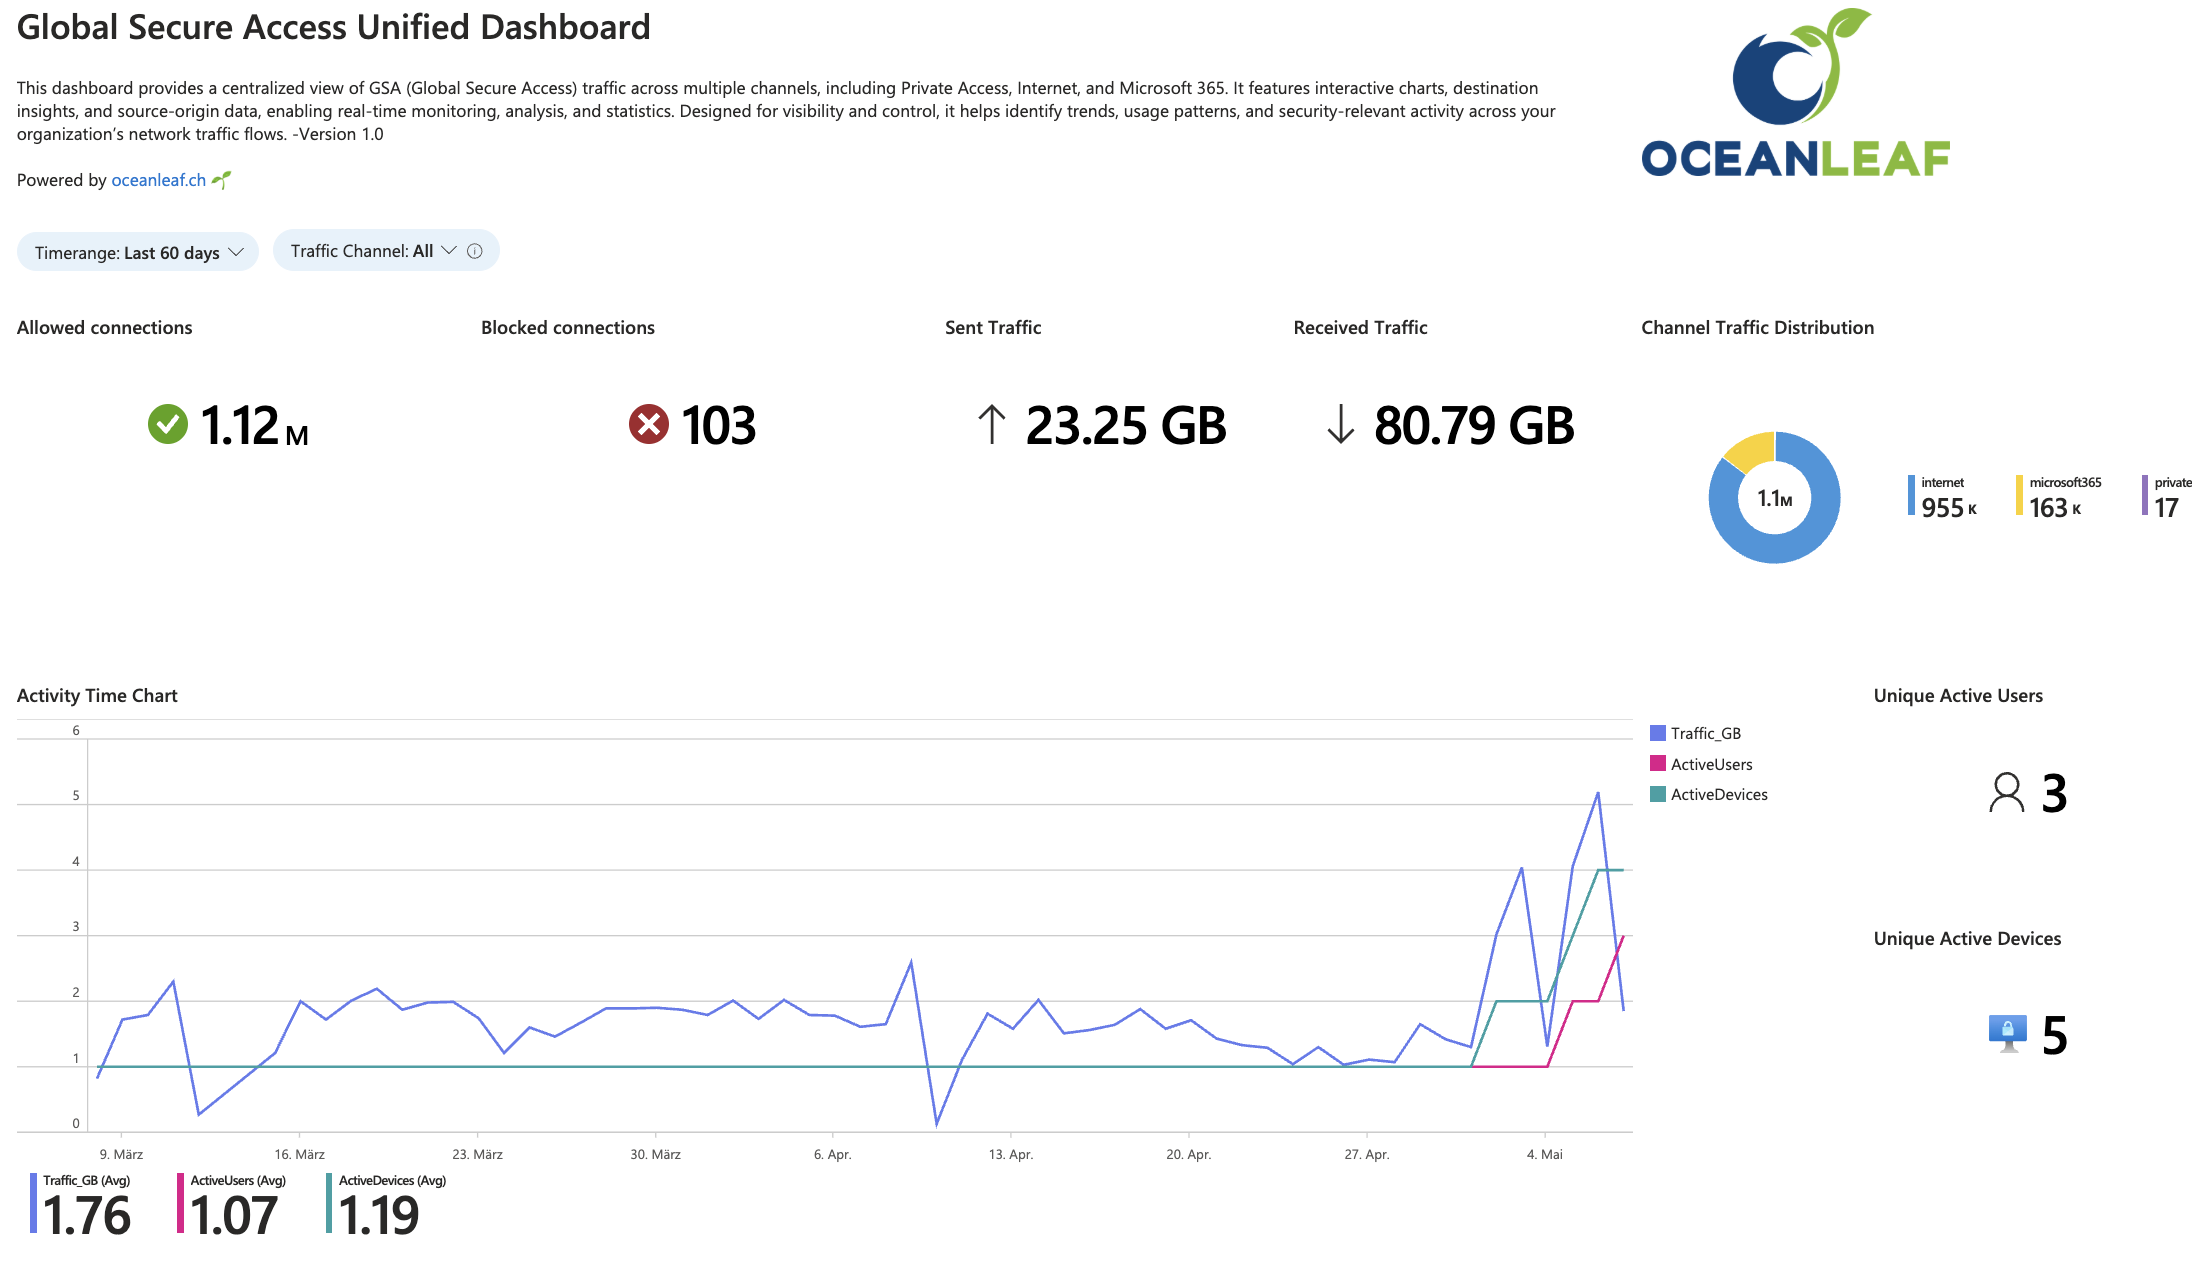
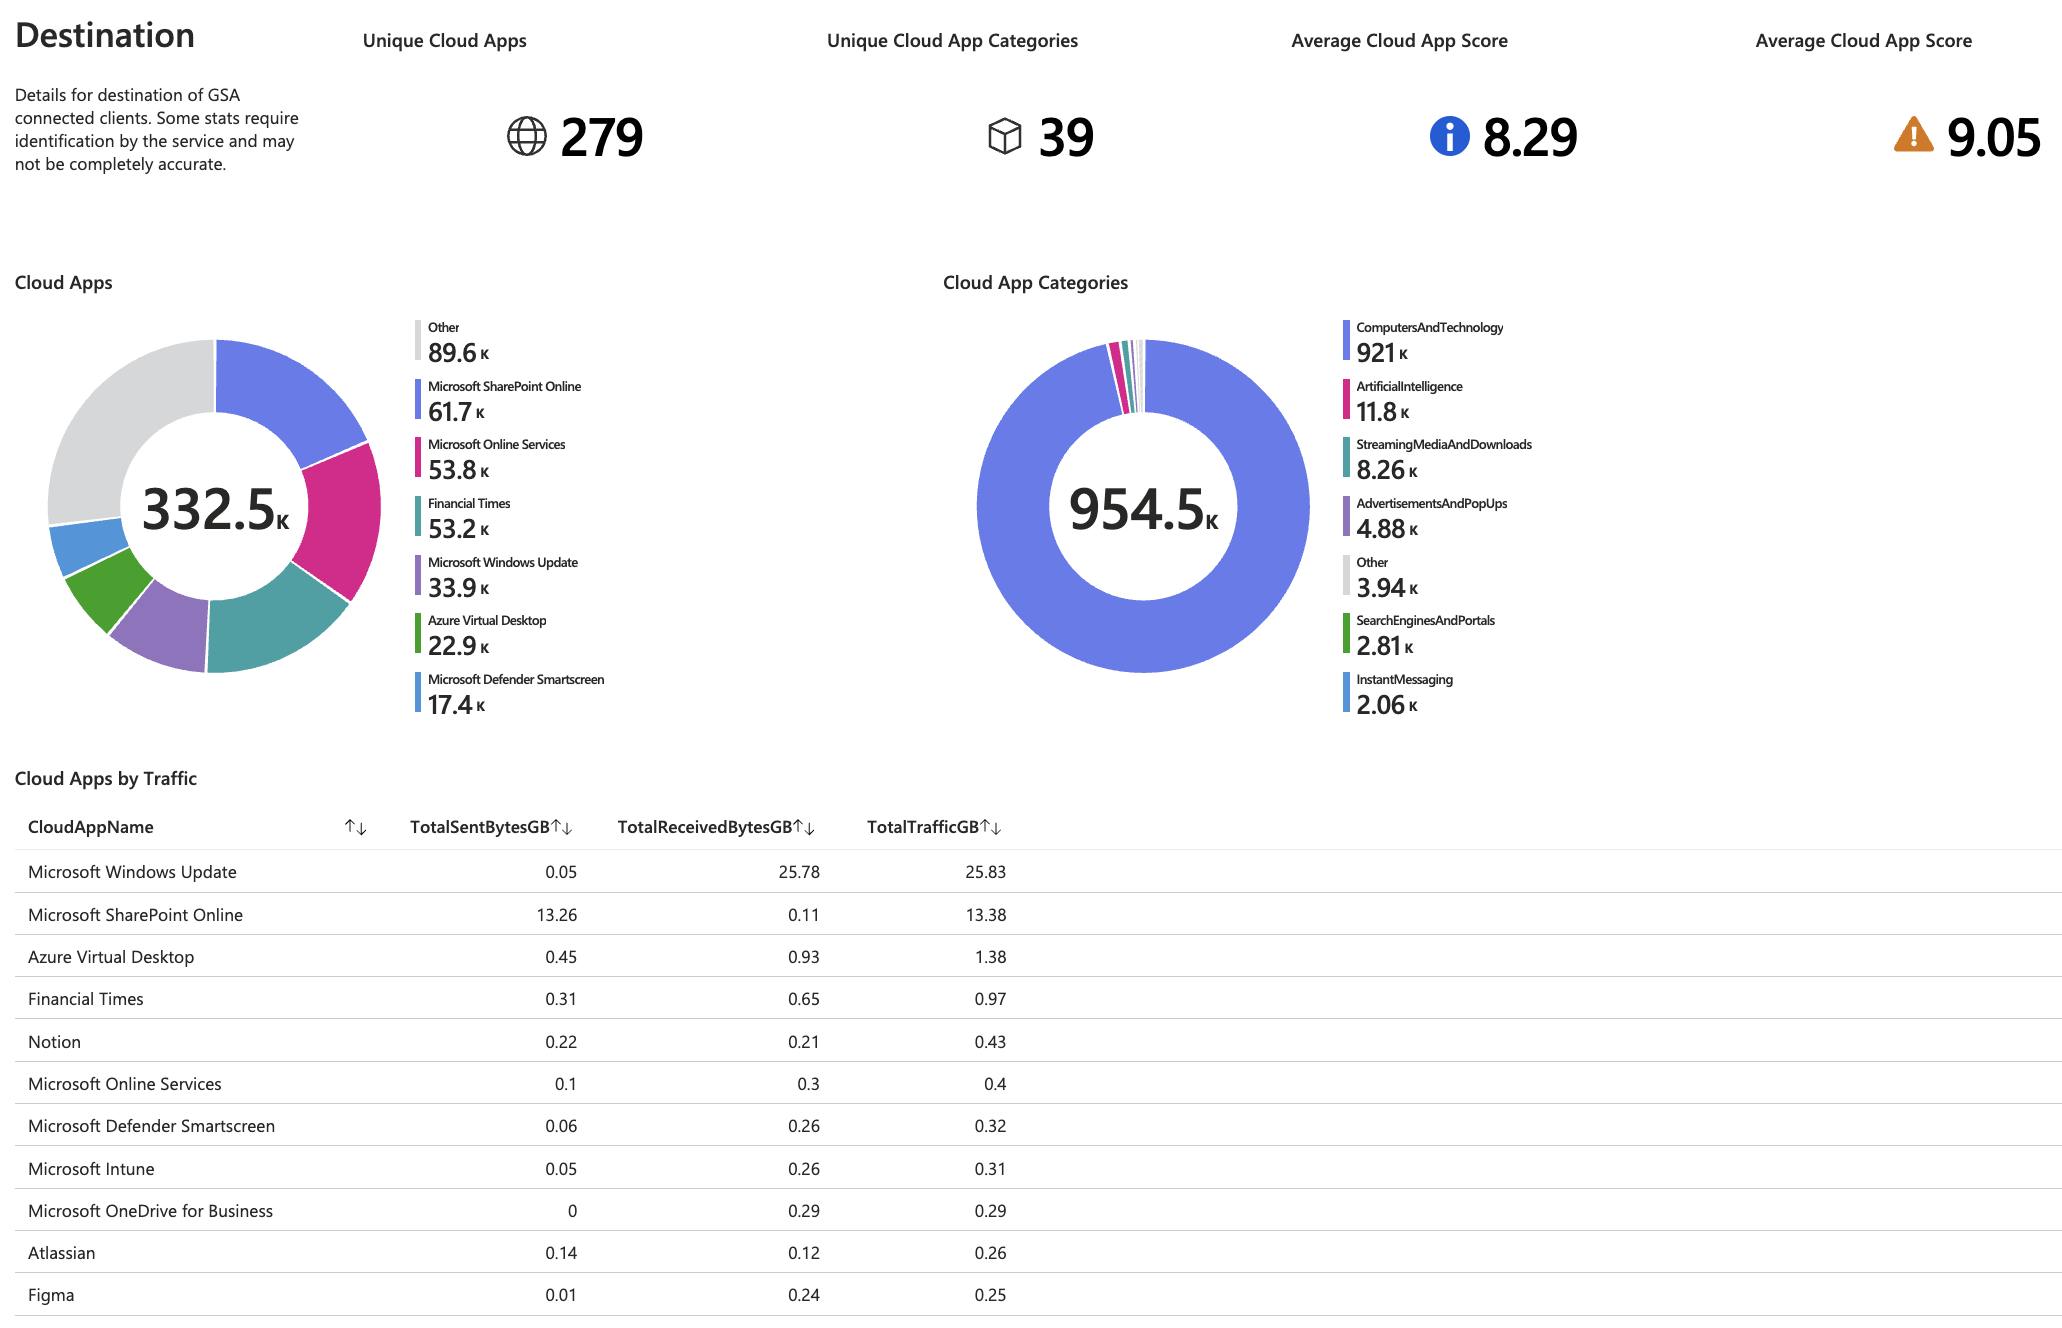
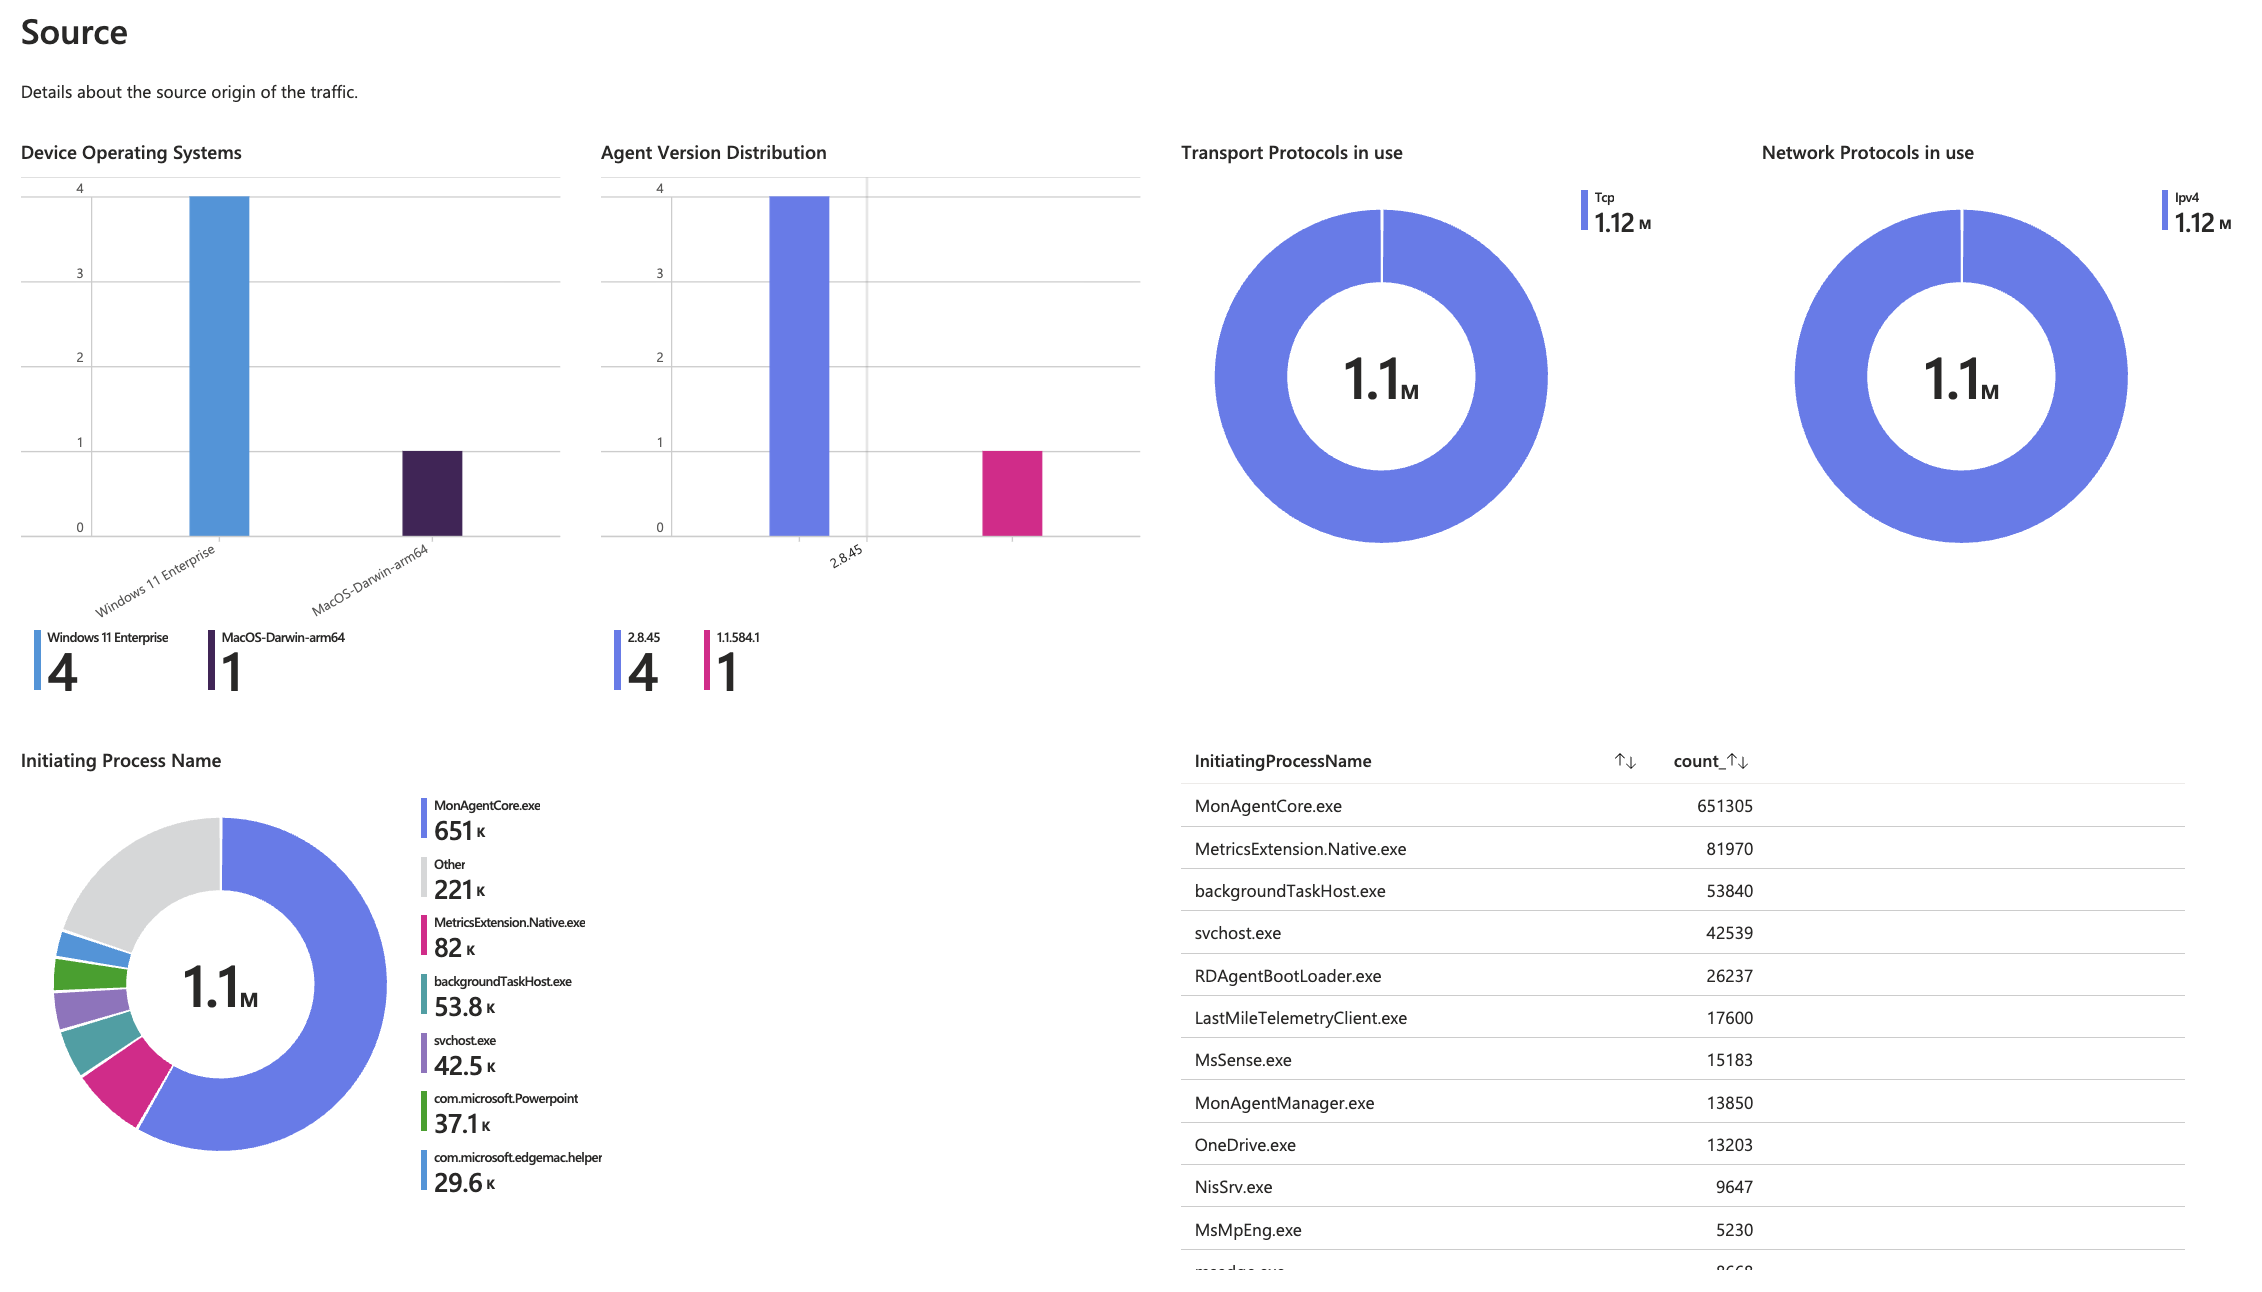
Unified Monitoring Dashboard (Azure Workbook) - Community
After playing around with the logs from GSA, I decided to build my own Azure Workbook to have a single-pane of glass experience when overviewing the product.
Features
- 📊 Interactive visualizations of traffic by source, destination, and protocol
- 🌐 Channel-specific insights for Private, Internet, and M365 traffic flows
- 📈 Real-time monitoring of usage volume, trends, and activity patterns
- 🔍 Detailed traffic statistics including sent/received bytes, top destinations, and user activity
- 🧩 Source-origin correlation to identify high-impact devices or users
- 🚦 Action and policy analysis for deeper investigation and filtering
Requirements
- Azure Log Analytics Workspace connected to Entra Diagnostics - Global Secure Access diagnostics
- Required tables:
NetworkAccessTraffic
Workbook sections
- Overview – General traffic summaries across GSA channels
- Channel Breakdown – Per-channel views (Private, Internet, M365) with top destinations, ports, users
- Source Insights – Active users, devices, IPs, and their traffic contributions
- Destination Analytics – FQDN/IP breakdowns with traffic volume
- Traffic Statistics – Sent/received GBs, protocol usage, and action types
powered by Oceanleaf